claude-works
Claude Infographics
A home for visual work produced by Claude — infographics, data visualizations, and Claude designs.
This repo is a publishing space: finished pieces get pushed here and indexed below. Works can be single HTML/MHTML files, images, GIFs, or whole site folders for more complex builds. HTML works are served live via GitHub Pages so you can view them rendered, not just as source.
🔗 Live site: https://satejp10.github.io/claude-works/
Gallery
How India Got Online — Pixel Quest |
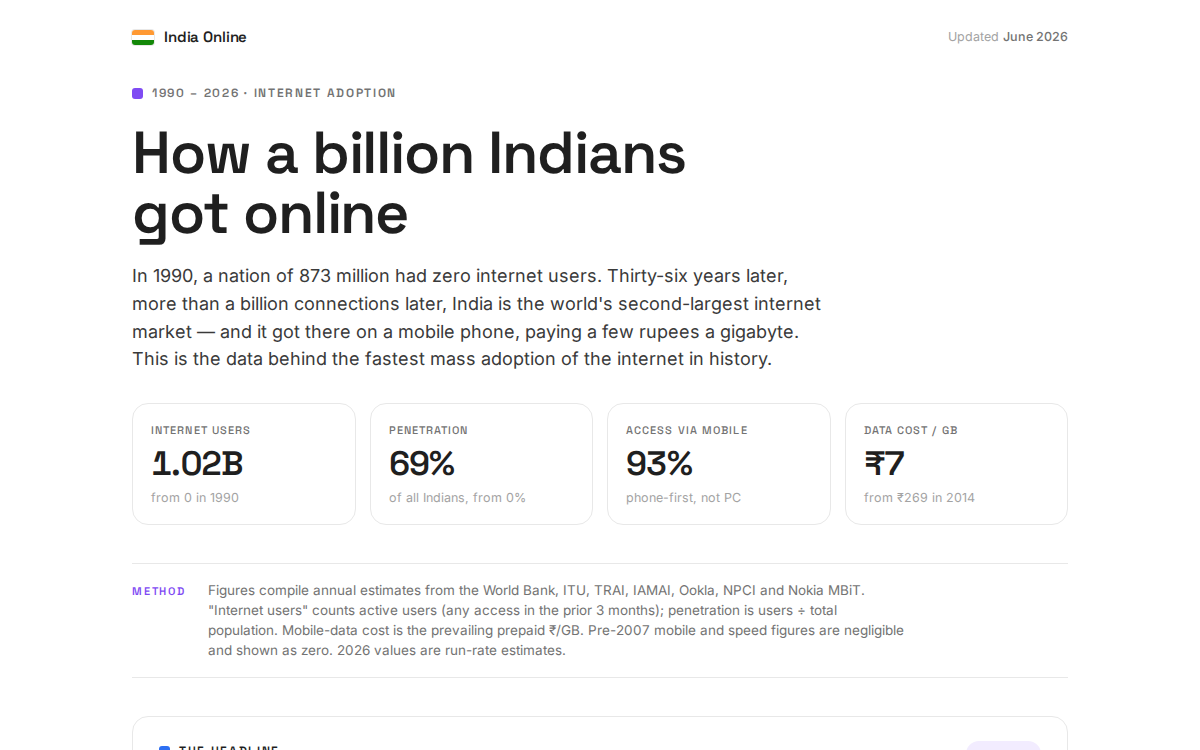 India Online — How a Billion Got Connected |
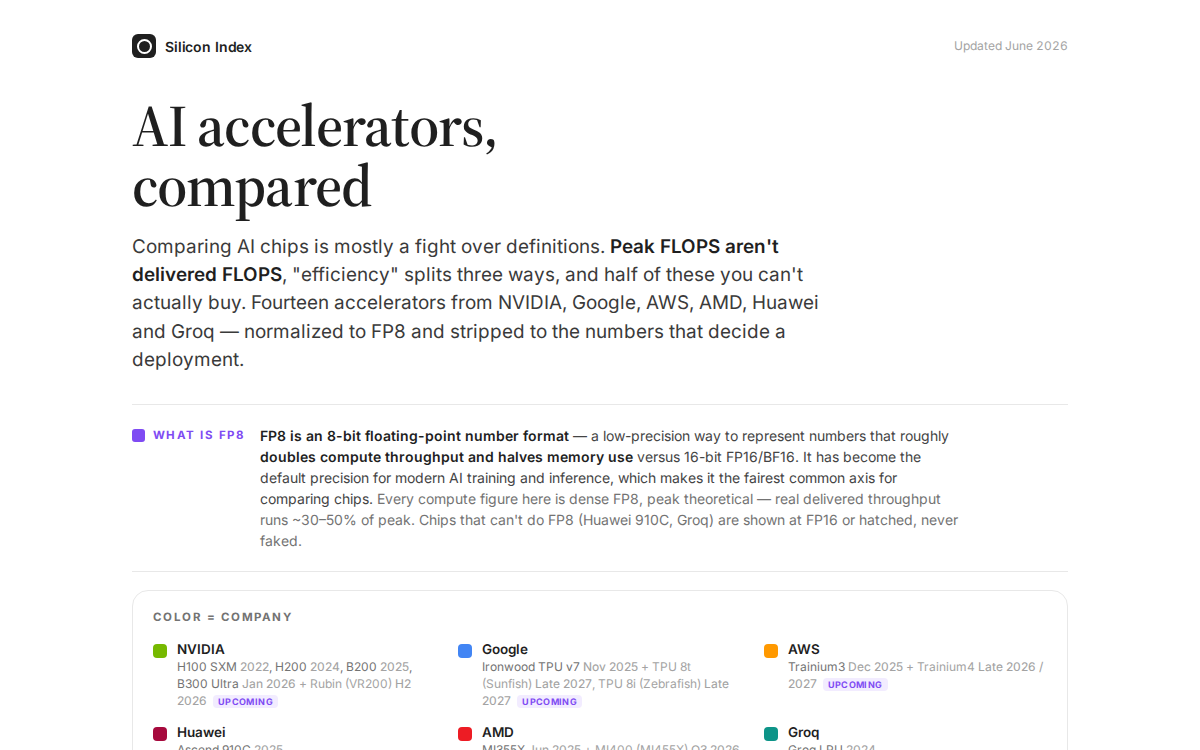 AI Engines, What Runs Your AI? |
 EDGE — Browser Recreation |
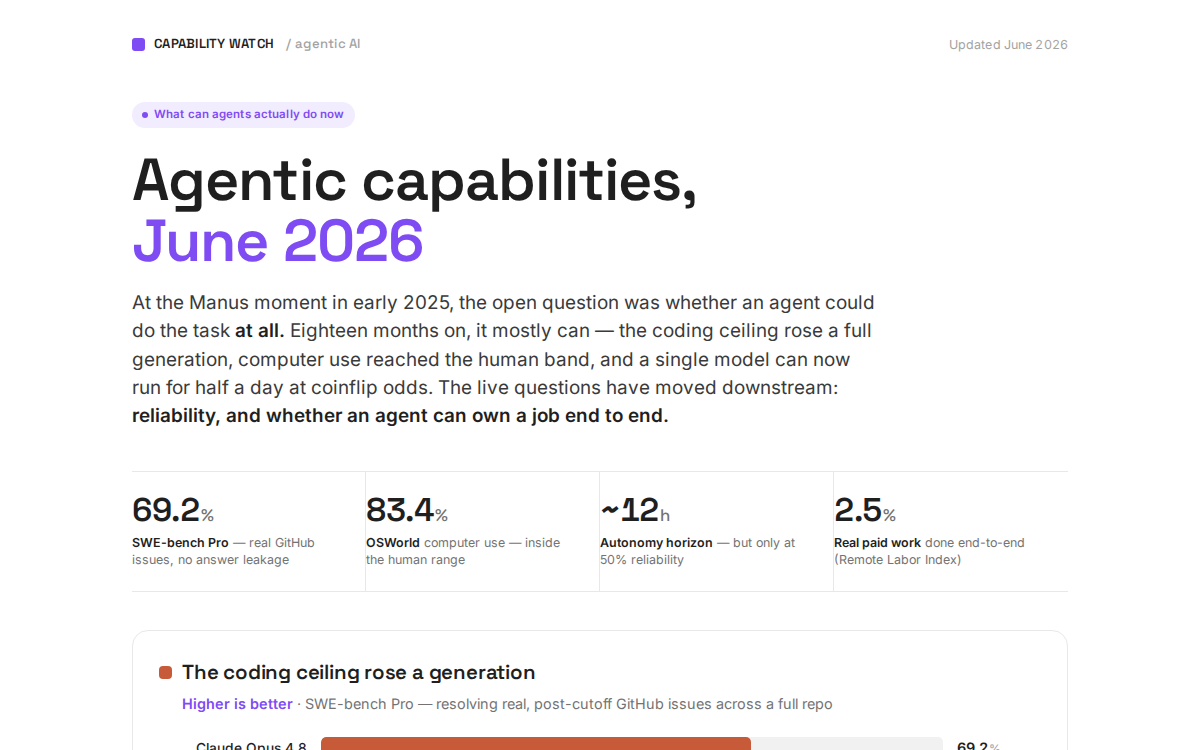 Agentic Capabilities |
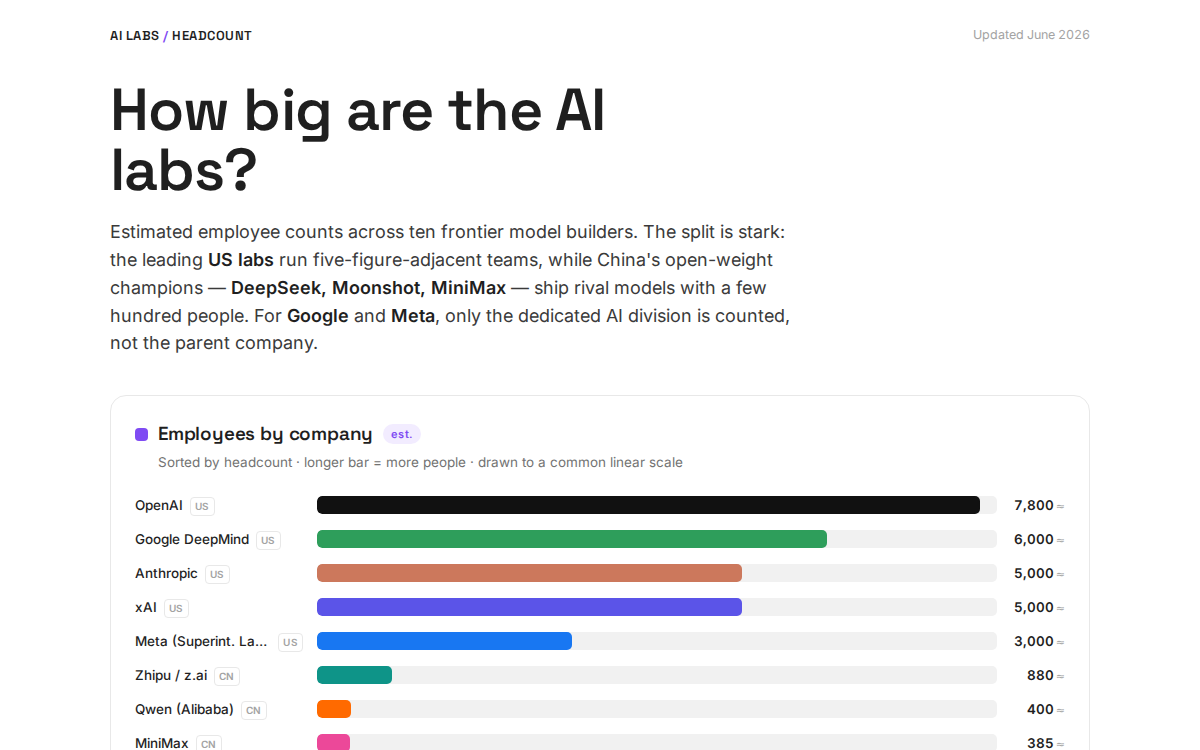 AI Labs, by Headcount |
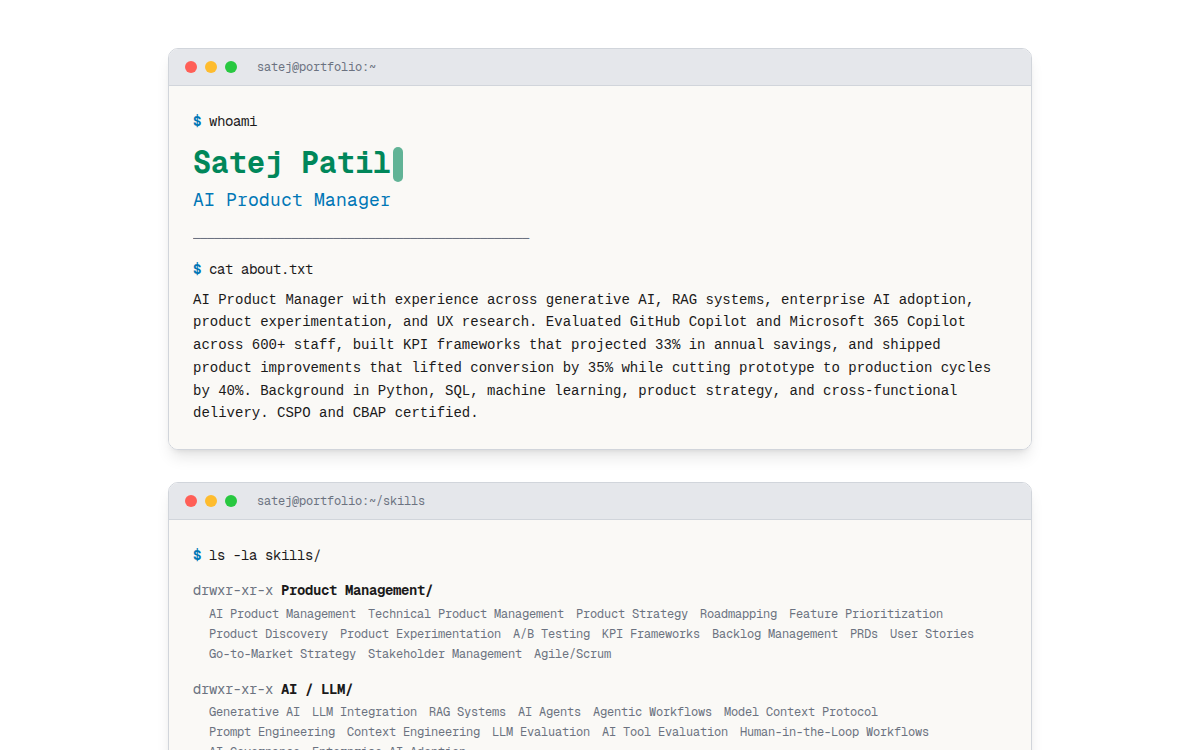 Terminal Portfolio |
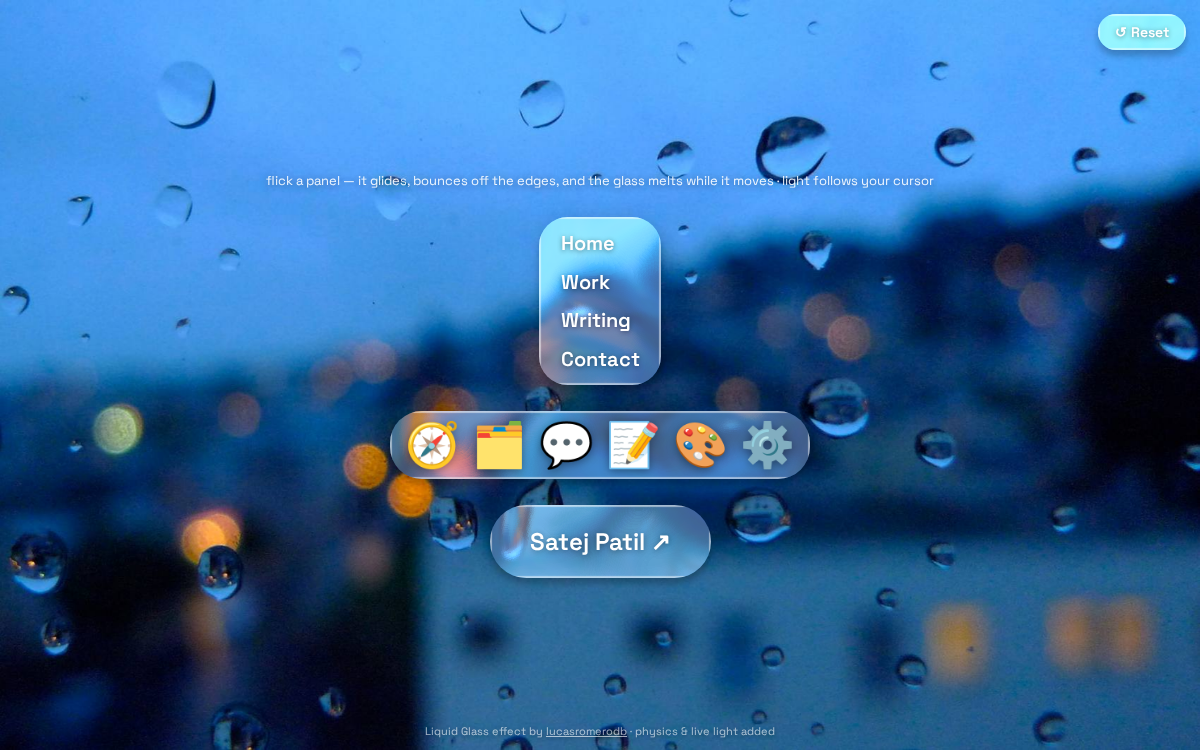 Liquid Glass — Design Trials |
Thumbnails above are generated automatically from the works below — see Adding a work.
Works
| Work | Type | Date | Links |
|---|---|---|---|
| How India Got Online — Pixel Quest — an interactive, gamified scrollytelling quest through the story of India’s internet adoption. (Completely overhauled rebuild.) | Interactive (HTML) | Jun 2026 | View · Source · Thumb |
| India Online — How a Billion Got Connected — the standalone data report: the charts and numbers behind India’s path from a handful of users to a billion connected. | Data report (HTML) | Jun 2026 | View · Source |
| AI Engines, What Runs Your AI? — what’s actually powering today’s models: FP8 compute-per-watt vs. memory bandwidth across 2026 AI chips, normalized to comparable definitions. | Infographic (HTML) | Jun 2026 | View · Source |
| EDGE — Browser Recreation — a playable, hand-rolled recreation of the 2008 puzzle-platformer EDGE: roll an isometric cube across tile levels collecting prisms, with fixed-timestep physics in vanilla JS + Canvas 2D (desktop keyboard + mobile touch). Lives in its own repo. | Game (JS/Canvas) | Jun 2026 | View · Source · Thumb |
| Agentic Capabilities — how far agents got by mid-2026: METR task-completion time horizons, the coding ceiling, and computer use crossing into the human band. | Infographic (HTML) | Jun 2026 | View · Source |
| AI Labs, by Headcount — estimated employee counts across ten frontier model builders: lean, five-figure-adjacent US teams vs. a few hundred people at China’s open-weight leaders. | Infographic (HTML) | Jun 2026 | View · Source |
| Terminal Portfolio — a terminal-styled personal portfolio for an AI product manager: skills, experience, and metrics laid out as shell commands (whoami, ls, git log, systemstats), with CRT scanlines and an inline-embedded font. | Portfolio (HTML) | Jun 2026 | View · Source |
| Liquid Glass — Design Trials — interactive glass-morphism design experiments (flick, drag, refract). | Design experiment (HTML) | Jun 2026 | View · Source |
Structure
claude-design-works/— design pieces and visual artifacts produced by Claude.
Adding a work
- Drop the file (or folder) into
claude-design-works/. - Add a row to the Works table above — name, type, date, and a
View(live Pages URL) +Sourcelink. - Commit and push. The Pages site updates automatically.
The Gallery thumbnails are generated automatically: a GitHub Actions workflow
renders each work in the Works table, writes a thumbnail to assets/thumbnails/, and rebuilds the gallery
block — so you never edit thumbnails by hand. Just add the table row; the picture follows on the next push.
To regenerate locally, run node .github/scripts/gen-thumbnails.mjs (needs npm install playwright).
Custom or animated thumbnails / external projects. Add a Thumb link to the row pointing at an
image you’ve committed under assets/thumbnails/ — e.g. · [Thumb](assets/thumbnails/my-work.gif). When a
Thumb is present the generator uses that image as-is and skips rendering, so you can use an animated GIF
instead of a static screenshot. This also lets you list a project that lives in another repo: give the
row a View link to its live demo, point Source at that repo, and supply a Thumb (no
claude-design-works/ file needed). To rebuild only the gallery block without rendering, run
SKIP_RENDER=1 node .github/scripts/gen-thumbnails.mjs (no Playwright required).